

From Reactive to Proactive: Salesforce Error Monitoring with the Error Console
Most teams working with Salesforce experience the same pattern when something goes wrong. Errors are rarely discovered when they occur. Instead, they surface only after something breaks and a user reports that a process or automation is not working.
From there, the familiar cycle begins. Admins investigate configurations, developers pull debug logs, and teams spend time tracing the root cause before deploying a fix. While this process eventually resolves the issue, it is reactive and often slows down troubleshooting.
With updates such as the Error Console introduced in the Spring ’26 release, Salesforce is gradually moving teams toward a more proactive approach to error monitoring.
The Reactive Reality in Most Salesforce Orgs
In many Salesforce environments, troubleshooting still follows a reactive workflow. Issues often surface only after something stops working, and the investigation begins once the problem is reported.
The process usually looks something like this:
Users report unexpected errors or broken functionality
Admins begin reviewing configurations and automation
Developers check logs and recreate debug logs to capture the issue
Teams attempt to recreate the error to understand the root cause
Recreating the issue is often the most difficult step. Errors that occur in production do not always appear consistently, making it more challenging to trace the exact cause.
Another limitation is the lack of centralized error visibility. Error signals are scattered across different tools and notifications, making debugging time consuming and production issues harder to trace.
What “Proactive” Actually Means in Salesforce
A proactive approach shifts the focus from reacting to failures to observing system behavior continuously. Instead of waiting for something to break, teams gain earlier signals about issues happening across the platform.
In practical terms, a proactive workflow in Salesforce involves:
Detecting issues before they escalate into user-facing problems
Monitoring errors from a single place instead of multiple tools
Identifying recurring patterns across automations and processes
Investigating issues faster with clearer context around errors
This is where Salesforce’s Error Console Panel begins to change the workflow, giving teams a more unified way to observe and analyze errors as they occur.
Introducing the Error Console
To support more proactive monitoring, Salesforce introduced the Error Console in the Spring ’26 release. The feature provides a way to capture and review page and component errors in Lightning Experience without constantly interrupting the user’s workflow.
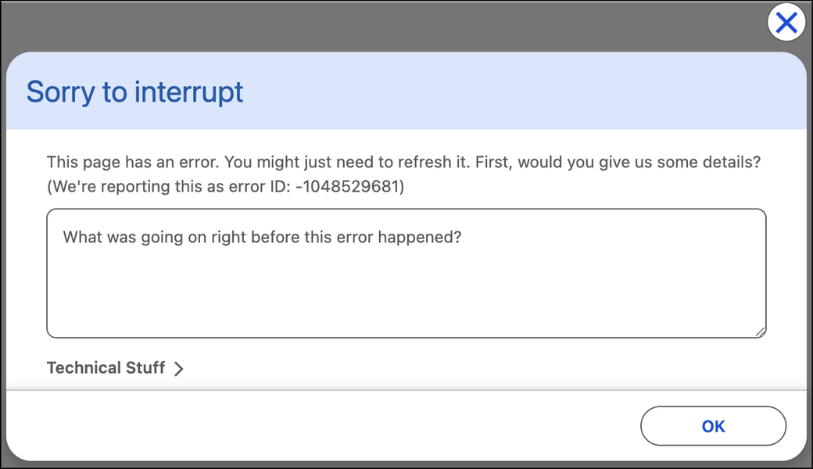
Before this update, runtime errors in Lightning Experience were typically displayed through modal error windows. These popups interrupted whatever the user was doing and required them to dismiss the message before continuing. While fatal errors were easy to notice because they stopped work immediately, other runtime errors were harder to track consistently.
The Error Console changes how these errors are surfaced. Non-fatal errors can now be captured in the background and logged in the console, allowing users to continue working without interruption.
Fatal errors may still appear in modal panels when immediate attention is required, but they are also recorded in the console. This allows admins and developers to review error history later, investigate issues more effectively, and maintain better visibility into system behavior.
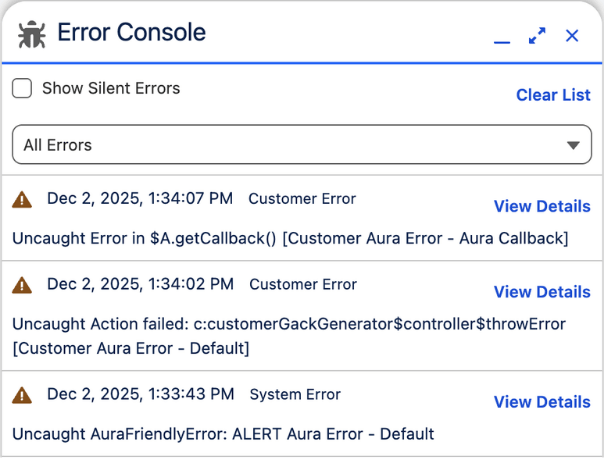
By collecting these errors in one place, the Error Console gives teams a clearer view of what is happening across the system while reducing unnecessary disruptions for users.
How to Enable the Error Console
Admins can enable the Error Console directly from the setup settings in Salesforce. Once enabled, the console begins capturing page and component errors in Lightning Experience.
To enable the feature:
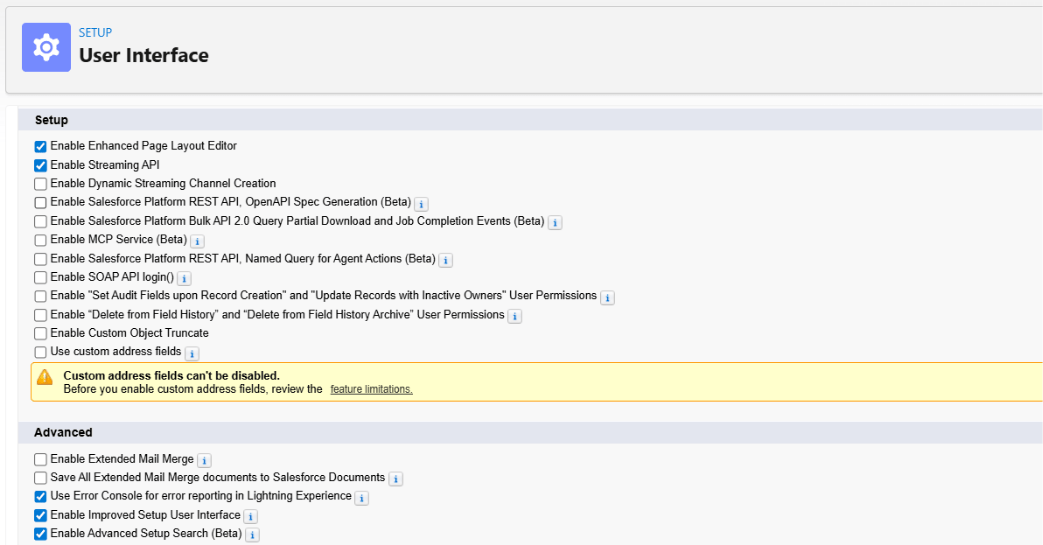
Go to Setup
In the Quick Find box, search for User Interface
Open User Interface settings
In the Advanced section, locate the option “Use Error Console for error reporting in Lightning Experience”
Check the box and click Save
Where the Error Console Appears in the UI
In Salesforce Lightning Experience, the Error Console appears in the bottom-right corner of the page.
More specifically:
When a non-fatal error or warning occurs, a small Error Console panel shows up in the bottom-right corner.
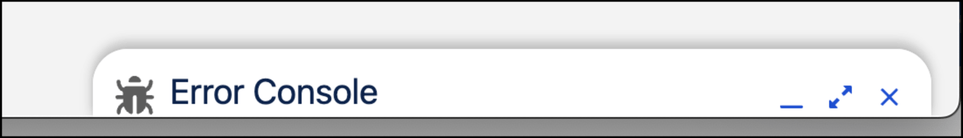
The panel stays collapsed by default, so it doesn’t interrupt what the user is doing.
It collects errors and warnings in the background while the user continues working.
Users can expand the panel to view details about the errors and warnings that were captured.
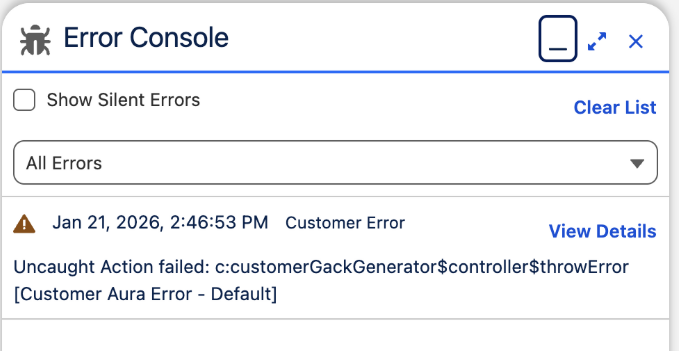
So visually, it behaves similar to other utility-style panels in Salesforce UI, visible but non-intrusive, allowing errors to be reviewed when convenient instead of immediately interrupting the workflow.
Why This Matters for Growing Salesforce Orgs
As Salesforce environments grow, they rarely stay simple. New automations are added, integrations connect external systems, and custom logic continues to expand across the platform.
With so many moving parts, even small errors can quickly affect multiple processes or users.
Without clear visibility into these issues, teams often spend a large amount of time investigating problems only after they occur. This reactive approach becomes harder to manage as the system becomes more complex.
Features like the Error Console help address this challenge by giving teams earlier insight into what is happening across the platform.
For growing Salesforce environments, this shift from reactive troubleshooting to proactive monitoring can significantly improve both system reliability and user experience.
Frequently Asked Questions
-
In Salesforce, fatal errors are critical errors that interrupt the user’s workflow and require the user to dismiss an error message before continuing. These errors usually appear as modal error windows.
Non-fatal errors, on the other hand, do not interrupt the user’s activity. The system can continue running even though the error occurred. With the Error Console enabled, these non-fatal errors are logged in the background so admins and developers can review them later.
-
Yes, the Error Console can be disabled at any time in Salesforce. Since it is controlled through a setup setting, admins can simply turn the feature off if they prefer the previous error behavior.
To disable it, follow the same process used to enable it. Go to Setup, search for User Interface in the Quick Find box, open User Interface settings, and uncheck the option “Use Error Console for error reporting in Lightning Experience.”
-
No, the Error Console does not replace debug logs in Salesforce. Debug logs are still used for deep technical analysis, while the Error Console provides a quicker way to view and track runtime errors directly within Lightning Experience.
Let’s Talk

Drop us a note, we’re happy to take the conversation forward 👇🏻